

Using an explanatory multiphase mixed method study, we investigated whether a bias awareness training would increase the awareness of implicit bias in peer-mentors for the orientation program at the Utrecht University School of Medicine. We also investigated whether the training would enable peer-mentors to provide a more inclusive orientation for beginning first-year students and whether this would lead to a higher feeling of inclusion and authenticity in first-year students. Below the results have been divided into two parts: ‘mentor’ and ‘student’ results. Each of these has been subdivided into quantitative and qualitative results.
Effect of training on mentor awareness
The response rate to the mentor survey was 45% in the first year (n = 18) and 33% in the second year (n = 13), giving a total response rate of 39% (n = 31). In both years, the majority of the mentors indicated that the bias training had increased their awareness (Fig. 2). Figure 2a shows the results divided into the five categories of the Likert scale (from ‘totally disagree’ to ‘totally agree’). When combining the results from both years, 61% of the mentors stated they (totally) agreed with the statement, “The bias training helped to increase my knowledge and awareness about diversity and inclusion,” while 19% of the mentors were neutral and 20% stated they (totally) disagreed. Between 2018 and 2019, the number of mentors who agreed with this statement increased (Fig. 2b). Although the increase was not statistically significant, there was a positive trend, suggesting there was an improvement in the training and its effects between the two years.
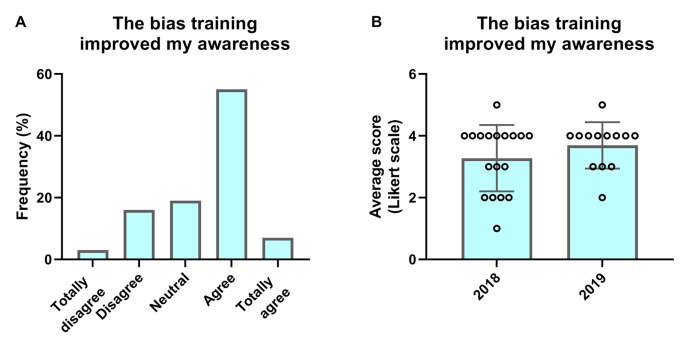
Peer-mentor response to statement, “The bias-training helped increase my knowledge and awareness about D&I”. (A) The mean results of 2018 and 2019 taken together, divided into the five categories of the Likert scale answer options. (B) The separate mean score for 2018 and 2019 (bar) and the individual answers (dots) for each year
Figure 3 shows to what extent the bias training improved the mentors’ ability to create an inclusive orientation program. For both years, 42% of the mentors agreed with the statement, “The bias training helped me provide an inclusive introduction for the first-year students” (Fig. 3a). 19% of the mentors (totally) disagreed, whereas 39% of mentors remained neutral. Compared to 2018, there was a significant increase in the number of mentors who agreed with this statement compared to the year before (Fig. 3b, M = 2.89, SD = 0.83 in 2018 compared to M = 3.62, SD = 0.65 in 2019, p = 0.014), showing a significant improvement in the training and its effects between the two years.
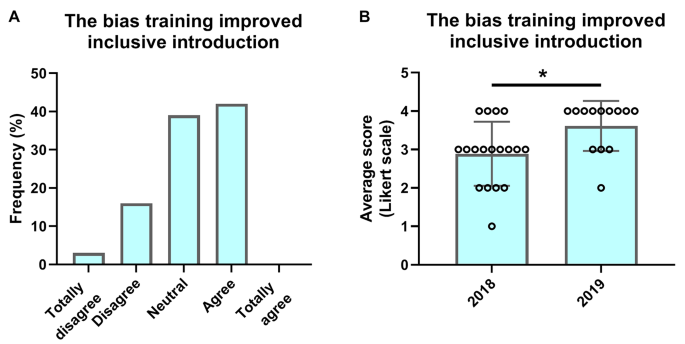
Peer-mentor response to statement, “The bias-training helped me provide an inclusive introduction for first-year students”. (A) The results of 2018 and 2019 taken together, divided into the five categories of the Likert scale answer options. (B) The separate mean score for 2018 and 2019 (bar) and the individual answers (dots) for each year. Statistical analysis shows a significant difference between 2018 and 2019 (Mann Whitney U test, W = 58,5, p = 0.014)
Table 2 shows the qualitative data analysis of the explicit situations in which mentors were able to apply the knowledge gained during the bias training. The answers to the three knowledge application questions (Q15-17, appendix B) were analysed together, coded and placed into six categories: ‘general’, ‘age’, ‘diet’, ‘religion’, ‘alcohol’ and ‘other’ (ordered from least often to most often mentioned situations). The category ‘general’ refers to mentors who were unable to give specific examples but did feel they were generally more capable of creating an inclusive environment.
An example of a situation in ‘other’ was from a mentor who mentioned that one of the students in their group did not know how to ride a bicycle. The mentor wrote: “One of the students in my group couldn’t ride a bicycle very well. When going to the university we arranged for her to sit on the back of someone else’s bike so we could all stay together.” A second example was about a girl who had autism: “One of the girls in my group had autism. I was able to include her in most activities and in the end, she was really a part of the group.”
A quote from a mentor about a situation in the category ‘religion’ was: “We waited at the beginning of a meal to give those who wanted, a chance to pray.” The category ‘age’ mostly refers to the active inclusion of first-year students who were not yet 18, and the category ‘alcohol’ to situations where students were actively included despite the nature of the activity and the involvement of drinking alcohol. The mentor might have emphasised that participating in the beer chant could also be done with non-alcoholic beverages, for instance.
From the suggestions for improvements (categorised as ‘alcohol’, ‘communication’ and ‘diet’), we were able to distil different types of situations in which mentors thought students might feel excluded (Table 3). In both 2018 and 2019, alcohol remains the biggest issue, as there are still activities that revolve around the consumption of alcohol such as a beer chant, where students go to a pub and sing songs together (generally while drinking alcoholic beverages such as beer), or a pub crawl.
One mentor wrote about a situation concerning ‘diet’: “I noticed that vegetarians and people who eat Halal […] started getting the feeling that the organisation had not taken dietary wishes into account very well, or that it wasn’t taken seriously enough.”
The category ‘communication’ refers to the communication about activities toward students and how framing things differently can increase the inclusion of all students. One answer which falls in both the categories ‘alcohol’ and ‘communication’: “Change the name of the Gnome Drinks session to the La Chouffe Drinks session, because the word ‘gnome’ can be perceived as an insult by people.” [La Chouffe is a brand of beer which has a picture of a gnome on the label]. Although the number of suggestions was low, the issues are important and need to be addressed in the future.
Internal consistency of the PGIS questionnaire
Although the PGIS questionnaire is a validated questionnaire, we determined the internal consistency of the questions in our sample, calculated by the Cronbach’s Alpha measure for the factors belonging and authenticity regarding mentors and peer students. The internal consistency was calculated with SPSS (IBM SPSS Statistics for Windows, version 26, IBM Corp., Armonk, N.Y., USA) and the resulting Cronbach’s Alpha was > 0.89 for all factors, indicating a high reliability between the sets of questions about belonging and authenticity. This was the case for both versions of the questionnaire.
First-year students’ sense of inclusion during the orientation period
We also investigated the impact of the bias training on the perceived inclusion of first-year students. First-year students completed a survey based on the Perceived Group Inclusion Scale (PGIS; [14]). The response rate for 2018 was 19% (n = 91) and for 2019 it was 23% (n = 112). The total response rate was 21% (n = 203). We collected information on the background of the students (demographics) and on their perceived inclusion with respect to belonging and authenticity in relation to their fellow first-year students (peers) and in relation to their peer-mentor (Table 4). The results shown in Table 4 are the mean and standard deviation because differences are more visible as such.
In both years, the mean overall inclusion was high. In 2018 students scored the mean overall inclusion at 3.90 (SD = 0.77) and in 2019 at 4.08 (SD = 0.66) on a scale from 1 to 5. The differences in demographics did not measurably affect whether a student felt included (Table 4). Looking at each of the different aspects separately (degree programme, gender, disability, birthplace of student or parents, parents’ educational level, sexual orientation, and religion), the mean overall inclusion remained 3.90 or higher (SD = 0.77).
When analysing belonging and authenticity separately, both were given a high mean score by students. The results of the survey show that students felt that their peers made them feel that they belonged to the group (belonging, peer students) with a mean score of 3.97 (SD = 0.78) in 2018 and 4.04 (SD = 0.72) in 2019. The peer-mentor also made them feel they belonged (belonging, mentor) with a mean score of 3.98 (SD = 0.83) in 2018 and 4.16 (SD = 0.78) in 2019. Additionally, students made their peers feel they could be their authentic selves (authenticity, peer students) with a mean score of 3.84 (SD 0.83) in 2018 and 4.00 (SD = 0.73) in 2019, and the students were also made to feel they could be their authentic selves by their peer-mentors (authenticity, mentor) with a mean score of 3.82 (SD = 0.83) in 2018 and 4.14 (SD = 0.75) in 2019.
The quantitative data are supported by the student reports on the orientation activities and on their experiences with the mentors, which were categorised as ‘friendly and involved’, ‘inclusion during activities’, ‘approach’, ‘good atmosphere’ and ‘respect’ (Table 5).
Results show that the students found the mentors consistently friendly and involved. One student wrote: “[The mentor] had a conversation with me. It made me feel seen as a person. She also tried to actively involve me in the student association, which made me feel she was happy I was there.” Moreover, most students said their mentor continually did their best to create cohesion in the group by including everyone and considering everyone’s opinion (category ‘inclusion during activities’). For example, a student said, “The mentor did his very best to ensure the group’s enthusiasm and to include everyone in everything. That was much appreciated and the atmosphere [in the group] was simply very pleasant.” Comments in the category ‘approach’ refer to mentors actively approaching students to ask how they experienced everything and how they were doing. One student wrote: “The mentor was very kind to us and very open. They really listened to everyone and gave the impression that they were genuinely interested. They also shared more personal stories of their own, making it easier for the rest of the group to share their stories.” Another student said: “Everyone was treated as an equal, [he] listened to everyone and tried to understand everyone.”
The students also valued the openness and respect the mentors showed, for instance when a student decided not to accompany the group to a party and their decision was respected (category ‘respect’). One student wrote: “When I decided not to go to bars, parties and such, the mentor said I was always welcome if I were to change my mind.” Another student said, “Nothing was obligatory, and your choices and opinions were appreciated.”
Feeling of authenticity for first-year students in 2019
The data show that first-year students generally felt included in both 2018 and 2019. Additionally, the data showed an increase in the mean score for authenticity that the students experienced due to their mentor (mean score of 3.82 (SD = 0.83) in 2018 and 4.14 (SD = 0.75) in 2019). Statistical analysis showed this difference was statistically significant (Mann-Whitney U test, W = 3977, p = 0.001; see Table 4). One of the underlying reasons could be the improvements made to the training between 2018 and 2019. Mentors found the training more useful in 2019, with the number of mentors agreeing with this statement increasing from 17 to 30% between the two years (data not shown). The increased level of authenticity the students felt, support the previously presented data showing the mentors felt better able to provide an inclusive introduction in 2019 compared to 2018 (Fig. 2b).
Although students were pleased with the atmosphere and the inclusion, there were still aspects of the introduction which require further attention. The answers to the question, “What can the introduction committee and/or the mentor do to make you feel more accepted, valued, welcome and at home?” were categorised as ‘alcohol and party alternatives’, ‘increased interaction’, ‘organisation’, ‘increased inclusion’ and ‘other’ (Table 6).
Although most students did not have a suggestion for improvements, there were still some comments to consider for the future. Of the suggestions that were given, most fell into the category ‘alcohol and party alternatives’, where students mentioned that there were not enough alternatives for the people who did not (want to) drink alcohol. One student wrote: “The orientation programme was very much about partying and alcohol in my opinion. Maybe an alternative evening programme for people who aren’t interested in partying would help. The programme could’ve also contained a cool assignment about the university.” Another student agreed with their answer: “If there is a party in the evening and I didn’t want to go, there wasn’t an alternative. Maybe they could take that more into account, that not everyone likes to party.” This is an important issue which needs to be managed better in future programmes.
An example of an improvement from the ‘organisation’ category was that more ‘free’ time should be scheduled for people to unwind and relax on their own. The schedule was quite full and for people who are more introverted, this can be tiring, as supported by one student’s answer: “I am quite introverted and I need time to recover after, for example, a big party. During the orientation programme I got the feeling that the programme was directed more at extroverts. If the amount of time between a party and the next activity would just be a bit longer, it would have helped me a lot. Now I often had to go home early because I get tired quickly during parties.”
Some students would have liked more activities to get to know each other better, categorised as ‘increased interaction’. One student wrote: “Even more activities or games that are specifically aimed at getting to know each other and creating a group feeling.” Another wrote: “More interaction with other groups, now I only got to know my own group really well.” One student also mentioned: “Maybe make sure that the groups are encouraged to come to all the orientation activities.”
