


A total of 102 professional players (mean age = 23,8 ± 5,5 SD, median 22) from three different sports including 51 professional soccer players (English Premier League (EPL)), 21 professional ice hockey players (National Hockey League (NHL)) and 30 professional rugby players (French Top 14 Rugby League (Top14)). We also tested a total of 173 elite amateurs (mean age = 23,5 ± 5,8 SD, median 22) with 136 from the NCAA university sports program in the US and 37 from a European Olympic sport-training center. We have also tested 33 non-athlete university students (mean age = 23,8 ± 5,0 SD, median 22) from the Université de Montréal.
We have previously reported that, given identical conditions, top professional soccer, ice hockey or rugby teams generate very similar sensitivity profiles3. For this reason the professionals are presented as a single population group. Similarly, we obtained identical functions for our two amateur cohorts (NCAA and Olympic training center) studied here so again, we show the elite amateurs as one group.
Figure 1 shows the session-by-session geometrical mean graphs for the three groups with the session number on the x-axis and the 3D-MOT speed thresholds on a log y-axis. The fits shown are log regression functions and the R2 corresponds to the amount of variance explained by the fit. The data clearly show that the professional athlete group starts at higher speed values with a much steeper learning slope as a function of training session then the elite amateurs. In turn, the elite-amateur group starts at the same level as the non-athletes but the learning function rapidly distances itself from the one obtained for thenon-athlete university group. To emphasize the learning rate differences between the groups, the small graph on the right shows the normalized data (Log(sessions score) – Log(initial score)). One can see that the three learning rate functions are distinct regardless of the initial starting point scores.
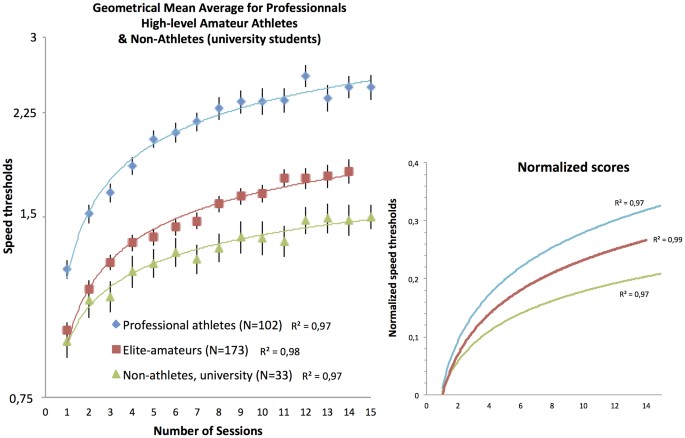
Geometrical 3D-MOT speed threshold means for 308 individuals on a log scale separated into professional, elite-amateur and non-athlete university students as a function of training sessions.
The y values are arbitrary speed units. Only 14 sessions are shown for the amateurs because the protocol for the Olympic training center athletes was pre-set to terminate at 14 sessions. Error bars represent SEM.
