


Study design
This research was a parallel randomized controlled trial that was conducted on undergraduate students in the operating room department of Khomein Faculty of Medical Sciences, Markazi Province in Iran from September 2022 to April 2023.
Participants
The number of operating room students were 70, who were included in the study by census method. Inclusion criteria included all operating room students who were in internship, and exclusion criteria included failure to complete the questionnaires.
Randomization and blindness
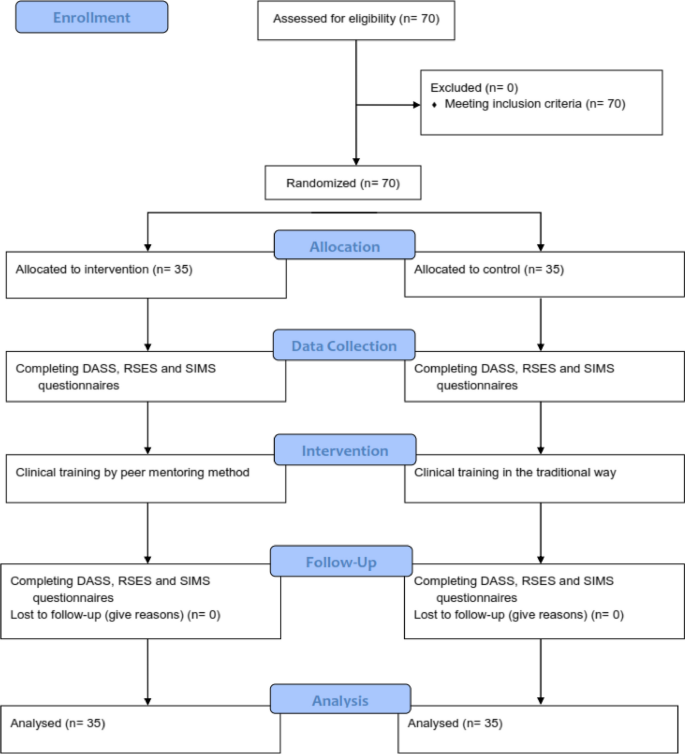
First, the students completed the written consent to participate in the study, and then they were divided into intervention and control groups by random allocation using Permuted Block Randomization [25]. Therefore, 35 participants were placed in each group. Then the participants of the intervention and control groups completed the questionnaires before the beginning of the internship. Due to the nature of the intervention in the present study, it was not possible to blind the subjects under the study. Therefore, blinding was performed on those who collected and recorded the data and those who performed the analysis. This research was designed and implemented according to the CONSORT guidelines (Fig. 1).
Instrument and data collection
The demographic questionnaire included gender, age, marital status, economic status of the family, education level of parents and occupation of parents.
Depression Anxiety Stress Scale (DASS) consists of three subscales including 7 questions for each. Each question is scored from 0 (does not apply to me at all) to 3 (completely applies to me). Each of the areas of stress, anxiety and depression has 7 questions and the minimum score for each area is 0 and the maximum score is 21. The score of each area is obtained from the sum of the scores of the answers given to the questions of that area. Antony et al. analyzed the mentioned scale; The results of the correlation calculation indicated a correlation coefficient of 0.48 between the two factors of depression and stress, a correlation coefficient of 0.53 between anxiety and stress, and a correlation coefficient of 0.28 between anxiety and depression [26]. The reliability of this scale in Iran in a sample of 400 participants was reported as 0.7 for depression, 0.66 for anxiety and 0.76 for stress [27]. Also, in the validation study of this questionnaire in Iran by Sahebi et al. the reliability of this scale was investigated through internal consistency and its validity using factor analysis and criterion validity with the simultaneous implementation of Beck depression, Zang anxiety and perceived stress tests. In general, the obtained reliability and validity coefficients were very satisfactory and significant at the p < 0.001 level. The correlations between DASS depression subscale with Beck depression test were 0.70, DASS anxiety subscale with Zang anxiety test was 0.67, and DASS stress subscale with perceived stress test was 0.49. The internal consistency of DASS scales was also calculated using Cronbach’s alpha and these results were obtained: depression 0.77, anxiety 0.79 and stress 0.78 [28].
Rosenberg Self-Esteem Scale (RSES) consists of 10 two-choice questions. Every statement that applies to the person receives the answer “I agree” and every statement that does not apply to the person receives the answer “I disagree”. A positive answer to each of statements 1 to 5 will receive a positive score of one, a negative response to statements 1 to 5 will receive a negative score of one, a positive response to statements 6 to 10 will receive a negative score of one, and a negative response to statements 6 to 10 will receive a positive score of one. Then the total score is calculated. A positive score of 10 indicates the highest level of self-esteem, and a negative score of 10 indicates very low self-esteem. The retest correlation is in the range of 0.82–0.88 and the internal consistency coefficient or Cronbach’s alpha is in the range of 0.77–0.88, this scale has satisfactory validity (0.77). It also has a high correlation with the New York and Guttman National Questionnaire in measuring self-esteem, so its content validity is also confirmed [29]. In Iran, Cronbach’s alpha coefficients of 0.84 to 0.92 have been reported for this scale. Also, the reliability and validity of this tool has been checked by factor analysis, dichotomization and re-sampling methods, and the results show that this scale can be used in Iran as well [30].
The Situational Motivational Scale (SIMS): After confirming the content validity of the tool in Iran, its reliability has been confirmed by retest method (73.76) and Cronbach’s alpha has been reported as 74–88%. The short form of this questionnaire was made by Bahrani in Shiraz. This questionnaire has 49 statements that are arranged on a Likert scale from completely disagree [1] to completely agree [5]. Reliability of the 49-question questionnaire used in this research was measured by Bahrani by retesting and calculating Cronbach’s alpha. In the retest method, the reliability coefficient of the whole test was 0.95. Also, the internal consistency of the questionnaire was calculated as 0.77 [31, 32].
Intervention program
In the control group, clinical training was done in the traditional way with the help of a trainer. In the intervention group, training was done by peer mentoring method with the help of fourth year operating room students and under the supervision of the instructor. Based on the overall GPA criteria, the first to sixth ranked students were selected as mentor students. Before using the students as mentors in the internship, 3 training sessions were held for them by the professors of the operating room.
In these meetings, the lesson plan of the internship course was fully explained based on the last chapter of the operating room field, and the necessary points regarding training and how to deal with students were explained.
Then, these students participated in three tests and the first to third students of each test were selected as mentors. Therefore, a total of nine students were selected as mentors. In the intervention group, internship training was carried out with the implementation of peer mentoring program during one academic semester. Students of the intervention group (35 participants) were placed in five groups of seven according to the internship program. The total training sessions of each group were 18 sessions, nine of which were conducted by the method of peer mentoring program. A total of 45 peer mentoring sessions were conducted for all groups. Each of the mentors mentored a seven-person group of mentees during nine sessions. At the beginning of each session, the mentor briefly explained the topics to the mentees according to the educational topics and guided them practically during the session. It should be noted that all the meetings were held under the supervision of the main teacher of the course and if necessary, this person provided the necessary guidance.
At the end of the academic semester, the Depression Anxiety Stress Scale, Rosenberg Self-Esteem Scale (RSES) and Situational Motivational Scale (SIMS) were completed again by the students of the intervention and control groups.
Statistical analysis
Stata software version 14 was used for the data analysis process. Initially, the data’s normality was verified using the Kolmogorov–Smirnov test. The results were presented as mean, standard deviation, frequency, and percentage in the section on descriptive statistics.
The means of the study variable between the intervention and control groups were compared using an independent t-test, and the means before and after the intervention were compared using a paired t-test in the analytical statistics section. The Chi-square test was used to compare the associations between qualitative variables in the various groups.
The ANCOVA test was conducted after the intervention to control for any baseline differences in scores of self-confidence, stress, perceived anxiety, depression and academic progress between the two groups before the intervention (pre-test). This adjustment was made to account for any potential confounding factors that may have influenced the outcomes.
Univariable and multivariable linear regression by the backward method was applied to examine the association between self-confidence, stress, perceived anxiety, depression, gender, mother’s education, father’s education, family economic, and academic progress. A significance threshold of less than 0.05 was used.
